Zathura is a fantastic PDF viewer. It also supports Postscript, DjVu, and Comicbook archive. In particular it supports using mupdf for the backend, so it’s rather fast (unlike poppler, used by evince and friends). Here is a screenshot of Zathura:
Figure 1: screenshot of zathura
Now that I’ve introduced Zathura. I want to talk about a problem I had
recently. I wanted to print a document a couple weeks ago, but found
whenever I issued a :print command in Zathura, the program would
crash. I got this error in dmesg:
[94592.482544] zathura[26424]: segfault at 201 ip 00007f0bc27d0086 sp 00007ffeada0d0d8 error 4 in libc-2.29.so[7f0bc2752000+158000]
[94592.482557] Code: 0f 1f 40 00 66 0f ef c0 66 0f ef c9 66 0f ef d2 66 0f ef db 48 89 f8 48 89 f9 48 81 e1 ff 0f 00 00 48 81 f9 cf 0f 00 00 77 6a <f3> 0f 6f 20 66 0f 74 e0 66 0f d7 d4 85 d2 74 04 0f bc c2 c3 48 83
§Lets get a crash dump
I spent a bunch of time trying to get crash dumps from Zathura, and was largely unsuccessful, until I realized the wonkiness I was dealing with (see below).
§Try to run Zathura in GDB
First I tried getting a backtrace directly from gdb. It appears to run, but zathura does not create a window:
winston@snowcrash ~ $ gdb --args zathura ~/docs/uni/classes/cs-655/handouts/spim_documentation.pdf
Reading symbols from zathura...
(gdb) run
Starting program: /usr/bin/zathura /home/winston/docs/uni/classes/cs-655/handouts/spim_documentation.pdf
[Thread debugging using libthread_db enabled]
Using host libthread_db library "/lib64/libthread_db.so.1".
[New Thread 0x7ffff5f26700 (LWP 18882)]
[New Thread 0x7ffff5725700 (LWP 18883)]

Cannot find user-level thread for LWP 18744: generic error
(gdb)
The error message Cannot find user-level thread for LWP 18744: generic error is mentioned on the Sourceware Wiki. The Wiki FAQ
suggests I may have a mismatch between libthread_db.so.1 and
libpthread.so.0 or am using a 64-bit debugger with a 32-bit
program. Both zathura and gdb are amd64 programs on my box. And I only
have one version of amd64 glibc installed. Given the facts, it seemed
like I was dealing with a different problem.
What’s more is I tested running a program in gdb, in my case cat,
and it worked fine:
winston@snowcrash ~ $ gdb cat
Reading symbols from cat...
(gdb) run
Starting program: /bin/cat
^C
Program received signal SIGINT, Interrupt.
0x00007ffff7eb5cb5 in __GI___libc_read (fd=0, buf=0x7ffff7fb0000, nbytes=131072) at ../sysdeps/unix/sysv/linux/read.c:26
26        return SYSCALL_CANCEL (read, fd, buf, nbytes);
§Try to attach a Zathura process in GDB
When attaching GDB to a process, make sure you have permission to do
so, out of the box most distros limit debuggers to either attach to
child processes or only if gdb is ran as root. In any case one can run
sysctl kernel.yama.ptrace_scope=0 to temporarily loosen restrictions
to allow attaching gdb to any process of the same user. See
ptrace(2) and grep for ptrace_scope.
Now that gdb can attach to any other processes I own, I tried to attach to zathura, without any success:
inston@snowcrash ~ $ gdb -p 3541 zathura
Reading symbols from zathura...
Attaching to program: /usr/bin/zathura, process 3541
ptrace: Operation not permitted.
(gdb)
Indeed this also worked fine with cat:
winston@snowcrash ~ $ gdb -p 6885 cat
Reading symbols from cat...
Attaching to program: /bin/cat, process 6885
Reading symbols from /lib64/libc.so.6...
Reading symbols from /usr/lib/debug//lib64/libc-2.29.so.debug...
Reading symbols from /lib64/ld-linux-x86-64.so.2...
Reading symbols from /usr/lib/debug//lib64/ld-2.29.so.debug...
0x00007f93b5fa4cb5 in __GI___libc_read (fd=0, buf=0x7f93b609f000, nbytes=131072) at ../sysdeps/unix/sysv/linux/read.c:26
26        return SYSCALL_CANCEL (read, fd, buf, nbytes);
(gdb)
§Try to get Zathura to dump core
I moved on to the next approach to get a backtrace — write core files. First I’ll describe what that entails on my setup:
§Enabling core dumps
Note: you’ll want to read up about systemd-coredump if using systemd.
On my setup, relatively vanilla Gentoo with OpenRC, it is
relatively straight forward to enable this — just create
/etc/security/limits.d/core.conf with the single line (see
limits.conf(5)):
* soft core unlimited
And re-login. Verify that the output of ulimit -a shows unlimited
core file size.
winston@snowcrash ~ $ ulimit -a
core file size          (blocks, -c) unlimited
data seg size           (kbytes, -d) unlimited
scheduling priority             (-e) 0
file size               (blocks, -f) unlimited
pending signals                 (-i) 63422
max locked memory       (kbytes, -l) 64
max memory size         (kbytes, -m) unlimited
open files                      (-n) 1024
pipe size            (512 bytes, -p) 8
POSIX message queues     (bytes, -q) 819200
real-time priority              (-r) 0
stack size              (kbytes, -s) 8192
cpu time               (seconds, -t) unlimited
max user processes              (-u) 63422
virtual memory          (kbytes, -v) unlimited
file locks                      (-x) unlimited
The second part is ensuring sysctl kernel.core_pattern is set so
something reasonable. If it’s a pipeline (first character is a
|), make sure you understand what that pipeline does, or set it
to a simple filename pattern. More information in core(5). A
good file pattern might be %e.%h.%t.core, which produces core
files such as cat.snowcrash.1586300242.core. Time can be
converted into a human readable form with date -d@1586300242.
winston@snowcrash ~ $ sudo sysctl kernel.core_pattern=%e.%h.%t.core
kernel.core_pattern = %e.%h.%t.core
winston@snowcrash ~ $ cat
^\Quit (core dumped)
winston@snowcrash ~ $ ls *.core
cat.snowcrash.1586300242.core
winston@snowcrash ~ $ coretime() { date -d @"$(cut -d. -f3 <<<"$1")"; }
winston@snowcrash ~ $ coretime cat.snowcrash.1586300242.core
Tue 07 Apr 2020 05:57:22 PM CDT
§Getting a core dump
I fired up Zathura for what felt like the tenth time, and triggered
the bug, but indeed, no core dump! I even tried running zathura, and
instead sending SIGQUIT (^\ — Control-Backslash in most terminals)
which should cause the process to dump core, but to no avail.
In the above shell session, I demonstrated that I was able to dump
core with cat, so indeed core dumps are enabled.
§Investigating why I can’t get a crash dump
This feels like madness. There is no obvious reason why I can’t get a backtrace via any of the above techniques. So I took a deep breath, and grabbed the source code, thinking they must be doing something a bit too clever for my liking.
§Getting the source
On Gentoo I usually do something like the following to grab program source:
winston@snowcrash ~ $ ebuild $(equery w zathura) prepare
 * zathura-0.4.5.tar.gz BLAKE2B SHA512 size ;-) ...                                                                     [ ok ]
 * checking ebuild checksums ;-) ...                                                                                    [ ok ]
 * checking miscfile checksums ;-) ...                                                                                  [ ok ]
>>> Unpacking source...
>>> Unpacking zathura-0.4.5.tar.gz to /var/tmp/portage/app-text/zathura-0.4.5/work
>>> Source unpacked in /var/tmp/portage/app-text/zathura-0.4.5/work
>>> Preparing source in /var/tmp/portage/app-text/zathura-0.4.5/work/zathura-0.4.5 ...
>>> Source prepared.
§Scanning the source
A quick scan of the source tree yields some most interesting files — including some that will become more interesting as you read on:
winston@snowcrash .../work/zathura-0.4.5 $ grep -riF ptrace .
./zathura/seccomp-filters.c:  /* prevent escape via ptrace */
./zathura/seccomp-filters.c:  DENY_RULE(ptrace);
./zathura/seccomp-filters.c:  /* prevent escape via ptrace */
Notice the filename. It appears Zathura utilizes seccomp, and
somehow messes about with debuggers use of ptrace(). Here is a tree
of the files I’ll be walking through:
winston@snowcrash .../work/zathura-0.4.5 $ tree -L 2 -F \
> -P 'meson*|README|AUTHORS|LICENSE|main.[ch]|*seccomp*.[ch]|zathura.[ch]|config.[ch]'
.
├── AUTHORS
├── data/
│   ├── icon-128/
│   ├── icon-16/
│   ├── icon-256/
│   ├── icon-32/
│   ├── icon-64/
│   └── meson.build
├── doc/
│   ├── api/
│   ├── configuration/
│   ├── installation/
│   ├── man/
│   ├── meson.build
│   └── usage/
├── LICENSE
├── meson.build
├── meson_options.txt
├── po/
│   └── meson.build
├── README
├── subprojects/
├── tests/
│   └── meson.build
└── zathura/
    ├── config.c
    ├── config.h
    ├── main.c
    ├── seccomp-filters.c
    ├── seccomp-filters.h
    ├── zathura.c
    └── zathura.h

16 directories, 16 files
§Where Seccomp is used in the code
Indeed if we look in seccomp-filters.c it has a couple lines that suggest
zathura prevents dumping core & using ptrace():
#define ADD_RULE(str_action, action, call, ...)                                \
  do {                                                                         \
    seccomp_rule_add(ctx, action, SCMP_SYS(call), __VA_ARGS__);                \
  } while (0)

#define DENY_RULE(call) ADD_RULE("kill", SCMP_ACT_KILL, call, 0)

int
seccomp_enable_basic_filter(void)
{
  /* prevent escape via ptrace */
  if (prctl(PR_SET_DUMPABLE, 0, 0, 0, 0)) {
    girara_error("prctl PR_SET_DUMPABLE");
    return -1;
  }
}
Please note I tidied up the code for clarity. Looking in prctl(2)
we can see the prctl(PR_SET_DUMPABLE, 0, 0, 0, 0) not only
prevents core dumps, but prevents processes from attaching to
Zathura to debug it.
Now to figure out how it’s called. Take a look at zathura.c.
bool
zathura_init(zathura_t* zathura)
{
#ifdef WITH_SECCOMP
  /* initialize seccomp filters */
  switch (zathura->global.sandbox) {
    case ZATHURA_SANDBOX_NONE:
      girara_debug("Sandbox deactivated.");
      break;
    case ZATHURA_SANDBOX_NORMAL:
      girara_debug("Basic sandbox allowing normal operation.");
      if (seccomp_enable_basic_filter() != 0) {
        girara_error("Failed to initialize basic seccomp filter.");
        goto error_free;
      }
      break;
    case ZATHURA_SANDBOX_STRICT:
      girara_debug("Strict sandbox preventing write and network access.");
      if (seccomp_enable_strict_filter() != 0) {
        girara_error("Failed to initialize strict seccomp filter.");
        goto error_free;
      }
      break;
  }
#endif
}
In the zathura_init procedure, seccomp is conditionally compiled
in using an an #ifdef check. It becomes apparent there are three
sandbox modes supported by Zathura. Next let’s see where
zathura_init() is called in main.c:
static zathura_t*
init_zathura(const char* config_dir, const char* data_dir,
             const char* cache_dir, const char* plugin_path, char** argv,
             const char* synctex_editor, Window embed)
{
  /* create zathura session */
  zathura_t* zathura = zathura_create();
  if (zathura == NULL) {
    return NULL;
  }

  /* Init zathura */
  if (zathura_init(zathura) == false) {
    zathura_free(zathura);
    return NULL;
  }

  return zathura;
}

/* main function */
GIRARA_VISIBLE int
main(int argc, char* argv[])
{
  /* CLI parsing and initialization */

  /* Create zathura session */
  zathura_t* zathura = init_zathura(config_dir, data_dir, cache_dir,
                                    plugin_path, argv, synctex_editor, embed);

  /* More initialization logic */

  /* run zathura */
  gtk_main();

  /* free zathura */
  return ret;
}
The program’s entry point, main() calls init_zathura(), which
itself calls zathura_init(), and then calls into
seccomp_enable_*_filter(). This makes it clear that Zathura
always initializes sandboxing on startup, unless
zathura->global.sandbox is ZATHURA_SANDBOX_NONE.
If one looks in the top level meson.build we can see where the
WITH_SECCOMP proprocessor definition comes from:
if seccomp.found()
  build_dependencies += seccomp
  defines += '-DWITH_SECCOMP'
  additional_sources += files('zathura/seccomp-filters.c')
endif
Now comes the matter how does one debug this application? Initially
I succeeded by configuring Gentoo to not use seccomp with
Zathura. After a second look, there appears to be a sandbox
configuration option. In the next few sections I explain how to
manually disable seccomp with both Gentoo USE flags, and by
configuring zathura at runtime.
§Disabling Seccomp by USE flag
Note: This disabling seccomp in the build is unnecessary! Please consider continuing on to the next section for a less invasive solution!
Taking a closer look at the app-text/zathura package in Gentoo’s
ebuild repository, there is a seccomp USE flag.
winston@snowcrash ~ $ eix -e app-text/zathura
[I] app-text/zathura
     Available versions:  0.4.3^t 0.4.4^t{tbz2} (~)0.4.5^t{tbz2} **9999*l^t {doc +magic seccomp sqlite synctex test}
     Installed versions:  0.4.5^t{tbz2}(05:21:00 PM 04/07/2020)(doc magic seccomp -sqlite -synctex -test)
     Homepage:            http://pwmt.org/projects/zathura/
     Description:         A highly customizable and functional document viewer
Let’s disable this seccomp USE flag:
snowcrash ~ # echo 'app-text/zathura -seccomp' >> /etc/portage/package.use/zathura
snowcrash ~ # emerge -1av app-text/zathura

These are the packages that would be merged, in order:

Calculating dependencies              ... done!
[ebuild   R   ~] app-text/zathura-0.4.5::gentoo  USE="doc magic -seccomp* -sqlite -synctex -test" 0 KiB

Total: 1 package (1 reinstall), Size of downloads: 0 KiB

Would you like to merge these packages? [Yes/No]
With Zathura rebuilt without seccomp support, I am able to attach a debugger. Success!
§Disabling Seccomp via configuration option
After reviewing zathura’s configuration code, I found there is a
sandbox option that can be configured in one’s zathurarc. It was
not mentioned in the zathura(1) manpage, nor its --help
text. I discovered it in the README. Later I also found it
mentioned in the zathurarc(5) manpage. As such, heed this
friendly reminder— make sure to read the README, and make sure to
read the related manpages in SEE ALSO section of a given
manpage!
Back to the matter at hand. Looking at config.c:
static void
cb_sandbox_changed(girara_session_t* session, const char* UNUSED(name),
                   girara_setting_type_t UNUSED(type), const void* value, void* UNUSED(data))
{
  g_return_if_fail(value != NULL);
  g_return_if_fail(session != NULL);
  g_return_if_fail(session->global.data != NULL);
  zathura_t* zathura = session->global.data;

  const char* sandbox = value;
  if (g_strcmp0(sandbox, "none") == 0) {
    zathura->global.sandbox = ZATHURA_SANDBOX_NONE;
  } else if (g_strcmp0(sandbox, "normal") == 0)  {
    zathura->global.sandbox = ZATHURA_SANDBOX_NORMAL;
  } else if (g_strcmp0(sandbox, "strict") == 0) {
    zathura->global.sandbox = ZATHURA_SANDBOX_STRICT;
  } else {
    girara_error("Invalid sandbox option");
  }
}

void
config_load_default(zathura_t* zathura)
{
  girara_session_t* gsession = zathura->ui.session;

  /* default to no sandbox when running in WSL */
  const char* string_value = running_under_wsl() ? "none" : "normal";
  girara_setting_add(gsession, "sandbox",
                     string_value, STRING, true,
                     _("Sandbox level"), cb_sandbox_changed,
                     NULL);
}
Now we know there is an event listener for the sandbox
configuration option. I know I skipped a few steps, but the
pattern is pretty clear for my purposes. After adding set sandbox none to my ~/.config/zathura/config, Zathura was able to start
up without a sandbox, and I was able to attach a debugger.
§Getting a more informative backtrace
Now, with seccomp disabled I was able to get a crash dump:
winston@snowcrash ~ $ gdb --args zathura ~/docs/uni/classes/cs-655/handouts/spim_documentation.pdf
Reading symbols from zathura...
(gdb) run
Starting program: /usr/bin/zathura /home/winston/docs/uni/classes/cs-655/handouts/spim_documentation.pdf
[Thread debugging using libthread_db enabled]
Using host libthread_db library "/lib64/libthread_db.so.1".
[New Thread 0x7ffff5f73700 (LWP 15633)]
[New Thread 0x7ffff5772700 (LWP 15634)]

(zathura:15629): dbind-WARNING **: 23:49:52.224: Couldn't register with accessibility bus: Did not receive a reply. Possible causes include: the remote application did not send a reply, the message bus security policy blocked the reply, the reply timeout expired, or the network connection was broken.
[New Thread 0x7fffe52b7700 (LWP 15639)]
[New Thread 0x7fffe4ab6700 (LWP 15645)]
[New Thread 0x7fffcbfff700 (LWP 15646)]

Thread 1 "zathura" received signal SIGSEGV, Segmentation fault.
__strlen_sse2 () at ../sysdeps/x86_64/multiarch/../strlen.S:120
120             movdqu  (%rax), %xmm4
(gdb) bt
#0  __strlen_sse2 () at ../sysdeps/x86_64/multiarch/../strlen.S:120
#1  0x00007ffff722753d in g_strjoinv () at /usr/lib64/libglib-2.0.so.0
#2  0x00007fffec65e31b in avahi_service_resolver_cb () at /usr/lib64/gtk-3.0/3.0.0/printbackends/libprintbackend-cups.so
#3  0x00007ffff73d4973 in g_task_return_now () at /usr/lib64/libgio-2.0.so.0
#4  0x00007ffff73d531d in g_task_return.part () at /usr/lib64/libgio-2.0.so.0
#5  0x00007ffff7429f0f in g_dbus_connection_call_done () at /usr/lib64/libgio-2.0.so.0
#6  0x00007ffff73d4973 in g_task_return_now () at /usr/lib64/libgio-2.0.so.0
#7  0x00007ffff73d49a9 in complete_in_idle_cb () at /usr/lib64/libgio-2.0.so.0
#8  0x00007ffff72064ef in g_main_context_dispatch () at /usr/lib64/libglib-2.0.so.0
#9  0x00007ffff72068c0 in g_main_context_iterate.isra () at /usr/lib64/libglib-2.0.so.0
#10 0x00007ffff7206bd3 in g_main_loop_run () at /usr/lib64/libglib-2.0.so.0
#11 0x00007ffff796a105 in gtk_main () at /usr/lib64/libgtk-3.so.0
#12 0x0000555555561871 in main ()
(gdb) frame 1
#1  0x00007ffff722753d in g_strjoinv () from /usr/lib64/libglib-2.0.so.0
(gdb) list
115     #ifdef AS_STRNLEN
116             andq    $-16, %rax
117             FIND_ZERO
118     #else
119             /* Test first 16 bytes unaligned.  */
120             movdqu  (%rax), %xmm4
121             PCMPEQ  %xmm0, %xmm4
122             pmovmskb        %xmm4, %edx
123             test    %edx, %edx
124             je      L(next48_bytes)
Notice how the frame’s listing shows assembly instructions. It looks like we are missing debug symbols. Additionally, it would be nice to have installed sources, because the debugger can show us line-for-line backtraces and will make it easy to single-step to the crash
§Installing debug symbols on Gentoo
On gentoo one can use equery b to discover what package owns a
particular file:
winston@snowcrash ~ $ for f in /usr/lib64/libglib-2.0.so.0 \
> /usr/lib64/gtk-3.0/3.0.0/printbackends/libprintbackend-cups.so \
> /usr/lib64/libgio-2.0.so.0 /usr/lib64/libglib-2.0.so.0 \
> /usr/lib64/libgtk-3.so.0; do
>     equery -q b $f
> done | sort -u
dev-libs/glib-2.60.7-r2
x11-libs/gtk+-3.24.13
I came up with the following packages to install debug symbols for:
dev-libs/glibx11-libs/gtk+:3- and
app-text/zathurafor good measure.
Using /etc/portage/env/debugsyms and
/etc/portage/env/installsources — Portage environment files
loosely based off the Gentoo Wiki — I can simply add the following
lines to my /etc/portage/package.env/:
dev-libs/glib debugsyms installsources
x11-libs/gtk+:3 debugsyms installsources
app-text/zathura debugsyms installsources
And then I manually re-emerged each package, because unfortunately Portage does not appear to consider environment files when determining when to rebuild packages.
snowcrash ~ # emerge -1av app-text/zathura dev-libs/glib x11-libs/gtk+:3

These are the packages that would be merged, in order:

Calculating dependencies           ... done!
[ebuild   R    ] dev-libs/glib-2.60.7-r2:2::gentoo  USE="dbus debug* (mime) xattr -fam -gtk-doc (-selinux) -static-libs -systemtap -test -utils" ABI_X86="32 (64) (-x32)" 0 KiB
[ebuild   R    ] x11-libs/gtk+-3.24.13:3::gentoo  USE="X cups examples introspection xinerama (-aqua) -broadway -cloudprint -colord -gtk-doc -test -vim-syntax -wayland" ABI_X86="(64) -32 (-x32)" 0 KiB
[ebuild   R   ~] app-text/zathura-0.4.5::gentoo  USE="doc magic -seccomp -sqlite -synctex -test" 0 KiB

Total: 3 packages (3 reinstalls), Size of downloads: 0 KiB

Would you like to merge these packages? [Yes/No]
Portage installed the source code under /usr/src/debug/${CATEGORY}/${PF},
where PF is the full package name, version, and revision, such
as /usr/src/debug/x11-base/xorg-server-1.20.5-r2. Debug symbols
will be installed under /usr/lib/debug.
§A better backtrace
After getting the debug symbols & sources installed, I now get the following backtrace:
winston@snowcrash ~ $ gdb --args zathura ~/docs/uni/classes/cs-655/handouts/spim_documentation.pdf
Reading symbols from zathura...
Reading symbols from /usr/lib/debug//usr/bin/zathura.debug...
(gdb) run
Starting program: /usr/bin/zathura /home/winston/docs/uni/classes/cs-655/handouts/spim_documentation.pdf
[Thread debugging using libthread_db enabled]
Using host libthread_db library "/lib64/libthread_db.so.1".
[New Thread 0x7ffff5f62700 (LWP 12321)]
[New Thread 0x7ffff5761700 (LWP 12322)]
[New Thread 0x7fffe52b7700 (LWP 12329)]
[New Thread 0x7fffe4ab6700 (LWP 12333)]
[New Thread 0x7fffcbfff700 (LWP 12334)]

Thread 1 "zathura" received signal SIGSEGV, Segmentation fault.
__strlen_sse2 () at ../sysdeps/x86_64/multiarch/../strlen.S:120
120             movdqu  (%rax), %xmm4
(gdb) bt
#0  __strlen_sse2 () at ../sysdeps/x86_64/multiarch/../strlen.S:120
#1  0x00007ffff721680d in g_strjoinv (separator=separator@entry=0x7fffec702546 "-", str_array=str_array@entry=0x555555e56ac0)
at ../glib-2.60.7/glib/gstrfuncs.c:2585
#2  0x00007fffec6fd31b in avahi_service_resolver_cb
(source_object=<optimized out>, res=<optimized out>, user_data=user_data@entry=0x555555e06040)
at /usr/src/debug/x11-libs/gtk+-3.24.13/gtk+-3.24.13/modules/printbackends/cups/gtkprintbackendcups.c:3223
#3  0x00007ffff73caf79 in g_task_return_now (task=0x555555ea01a0 [GTask]) at ../glib-2.60.7/gio/gtask.c:1209
#4  0x00007ffff73cba9d in g_task_return (task=0x555555ea01a0 [GTask], type=<optimized out>) at ../glib-2.60.7/gio/gtask.c:1278
#5  0x00007ffff73cc00c in g_task_return (type=G_TASK_RETURN_SUCCESS, task=<optimized out>) at ../glib-2.60.7/gio/gtask.c:1678
#6  g_task_return_pointer (task=<optimized out>, result=<optimized out>, result_destroy=<optimized out>)
at ../glib-2.60.7/gio/gtask.c:1683
#7  0x0000000000000000 in  ()
If you feel inclined, here is the full backtrace (bt full).
A lot more useful, huh?
§Analyzing the crash
Knowing GDB is a powerful, useful skill. Nothing beats understanding your debugger. Not even printf debugging.
Let’s start with the source of the crash:
(gdb) frame 0
#0  __strlen_sse2 () at ../sysdeps/x86_64/multiarch/../strlen.S:120
120             movdqu  (%rax), %xmm4
(gdb) list
115     #ifdef AS_STRNLEN
116             andq    $-16, %rax
117             FIND_ZERO
118     #else
119             /* Test first 16 bytes unaligned.  */
120             movdqu  (%rax), %xmm4
121             PCMPEQ  %xmm0, %xmm4
122             pmovmskb        %xmm4, %edx
123             test    %edx, %edx
124             je      L(next48_bytes)
(gdb) info registers rax
rax            0x61                97
So strlen is trying to derefence address 0x61, that doesn’t look
right. Cheking the output of info proc mappings shows zathura
doesn’t have mapped memory that corresponds to the value in rax.
(gdb) info proc mappings
process 12314
Mapped address spaces:

          Start Addr           End Addr       Size     Offset objfile
      0x555555554000     0x55555555f000     0xb000        0x0 /usr/bin/zathura
      0x55555555f000     0x555555581000    0x22000     0xb000 /usr/bin/zathura

…SNIP…

      0x7ffff7ffd000     0x7ffff7ffe000     0x1000    0x27000 /lib64/ld-2.29.so
      0x7ffff7ffe000     0x7ffff7fff000     0x1000        0x0
      0x7ffffffdd000     0x7ffffffff000    0x22000        0x0 [stack]
  0xffffffffff600000 0xffffffffff601000     0x1000        0x0 [vsyscall]
Now let’s carry on with the second frame.
(gdb) frame 1
#1  0x00007ffff721680d in g_strjoinv (separator=separator@entry=0x7fffec702546 "-", str_array=str_array@entry=0x555555e56ac0)
    at ../glib-2.60.7/glib/gstrfuncs.c:2585
2585          for (i = 1; str_array[i] != NULL; i++)
(gdb) info frame
Stack level 1, frame at 0x7fffffffd140:
 rip = 0x7ffff721680d in g_strjoinv (../glib-2.60.7/glib/gstrfuncs.c:2585); saved rip = 0x7fffec6fd31b
 called by frame at 0x7fffffffd200, caller of frame at 0x7fffffffd0f0
 source language c.
 Arglist at 0x7fffffffd0e8, args: separator=separator@entry=0x7fffec702546 "-", str_array=str_array@entry=0x555555e56ac0
 Locals at 0x7fffffffd0e8, Previous frame's sp is 0x7fffffffd140
 Saved registers:
  rbx at 0x7fffffffd108, rbp at 0x7fffffffd110, r12 at 0x7fffffffd118, r13 at 0x7fffffffd120, r14 at 0x7fffffffd128,
  r15 at 0x7fffffffd130, rip at 0x7fffffffd138
(gdb) list
2580          gsize separator_len;
2581
2582          separator_len = strlen (separator);
2583          /* First part, getting length */
2584          len = 1 + strlen (str_array[0]);
2585          for (i = 1; str_array[i] != NULL; i++)
2586            len += strlen (str_array[i]);
2587          len += separator_len * (i - 1);
2588
2589          /* Second part, building string */
(gdb) print *str_array
$1 = (gchar *) 0x555555cea670 "Canon"
(gdb) print str_array[1]
$2 = (gchar *) 0x555555dac870 "MF632C"
(gdb) print str_array[2]
$3 = (gchar *) 0x555555e87150 "634C"
(gdb) print str_array[3]
$4 = (gchar *) 0x61 <error: Cannot access memory at address 0x61>
Indeed, we cannot access memory of address 0x61. And looking at the
source and documentation for g_strjoinv, the str_array argument
should be a NUL terminated array of strings.
Let’s look at the third frame.
(gdb) frame 2
#2  0x00007fffec6fd31b in avahi_service_resolver_cb (source_object=<optimized out>, res=<optimized out>,
    user_data=user_data@entry=0x555555e06040)
    at /usr/src/debug/x11-libs/gtk+-3.24.13/gtk+-3.24.13/modules/printbackends/cups/gtkprintbackendcups.c:3223
3223                  data->printer_name = g_strjoinv ("-", printer_name_compressed_strv);
(gdb) info frame
Stack level 2, frame at 0x7fffffffd200:
 rip = 0x7fffec6fd31b in avahi_service_resolver_cb
    (/usr/src/debug/x11-libs/gtk+-3.24.13/gtk+-3.24.13/modules/printbackends/cups/gtkprintbackendcups.c:3223);
    saved rip = 0x7ffff73caf79
 called by frame at 0x7fffffffd220, caller of frame at 0x7fffffffd140
 source language c.
 Arglist at 0x7fffffffd138, args: source_object=<optimized out>, res=<optimized out>, user_data=user_data@entry=0x555555e06040
 Locals at 0x7fffffffd138, Previous frame's sp is 0x7fffffffd200
 Saved registers:
  rbx at 0x7fffffffd1c8, rbp at 0x7fffffffd1d0, r12 at 0x7fffffffd1d8, r13 at 0x7fffffffd1e0, r14 at 0x7fffffffd1e8,
  r15 at 0x7fffffffd1f0, rip at 0x7fffffffd1f8
(gdb) list
3218                          printer_name_compressed_strv[j] = printer_name_strv[i];
3219                          j++;
3220                        }
3221                    }
3222
3223                  data->printer_name = g_strjoinv ("-", printer_name_compressed_strv);
3224
3225                  g_strfreev (printer_name_strv);
3226                  g_free (printer_name_compressed_strv);
3227                  g_free (printer_name);
(gdb) print printer_name_compressed_strv
$5 = (gchar **) 0x555555e56ac0
Note the value of printer_name_compressed_strv of 0x555555e56ac0
corresponds to the value of str_array in the previous frame
(g_strjoinv()). The full definition of avahi_sernvice_resolver_cb
can be read on Gnome’s GitLab.
As mentioned above, we found the sentinel value of the string array was not NUL. Looking at the following code, do you see the bug? I honestly didn’t:
printer_name = g_strdup (name);
g_strcanon (printer_name, PRINTER_NAME_ALLOWED_CHARACTERS, '-');

printer_name_strv = g_strsplit_set (printer_name, "-", -1);
printer_name_compressed_strv = g_new0 (gchar *, g_strv_length (printer_name_strv));
for (i = 0, j = 0; printer_name_strv[i] != NULL; i++)
  {
    if (printer_name_strv[i][0] != '\0')
      {
        printer_name_compressed_strv[j] = printer_name_strv[i];
        j++;
      }
  }

data->printer_name = g_strjoinv ("-", printer_name_compressed_strv);
After spending some time refamiliarizing myself with glib, GTK+, and Googling, it became apparently after I found the commit that fixed it. Let me preface the found commit with a brief explaination.
-
g_strcanon()replaces characters not inPRINTER_NAME_ALLOW_CHARACTERSwith a hyphen, i.e."Canon MF632C/634C"becomes"Canon-MF632C-634C" -
g_strsplit_set()splitsprinter_nameon"-", giving the following array:(gdb) print *printer_name_strv@g_strv_length(printer_name_strv)+1 $12 = {0x555555eff250 "Canon", 0x555555ece120 "MF632C", 0x555555f397e0 "634C", 0x0} -
g_new0()initializes a zero-filled array of pointers of length 3, the number of splitted elements returned byg_strsplit_set() -
The for loop copies over the contents of printer_name_strv, but skips empty elements - e.g. in the case that the above string had two adjacent hypens.
-
The
g_strjoinv()joins each string in theprinter_name_compressed_strvarray of strings, joining them on"-".The problem occurs because the call to
g_new0does not account for the extra array sentinel element. Indeed that is what the GitLab commit discusses.
§Best way to fix it?
In this case, I did what is best for my time effort. GTK+ 3.24.14 has been out for a couple months, and GTK+ 3.24.13 is not much older. So instead of dealing with backports, that is making a patch for the older version of GTK+ and adding it to my install, I took the liberty to bump my local GTK+ 3 install to GTK+ 3.24.14.
Either is not too tricky, in all honesty, given adding patches to a
Gentoo system is as easy as placing the patch in the correct
path. And bumping the ebuild usually entails simply unmasking it via
accepting the keyworded version (in my case ~amd64).
As such this is all I had to do to fix the issue:
snowcrash ~ # echo '~x11-libs/gtk+-3.24.14 ~amd64' >> /etc/portage/package.accept_keywords/gtk
snowcrash ~ # emerge -uDU -av --changed-deps --verbose-conflicts @world

These are the packages that would be merged, in order:


[ebuild     U ~] x11-libs/gtk+-3.24.14:3::gentoo [3.24.13:3::gentoo] USE="X cups examples introspection xinerama (-aqua) -broadway -cloudprint -colord -gtk-doc -test -vim-syntax -wayland" ABI_X86="(64) -32 (-x32)" 0 KiB

Total: 1 package (1 upgrade), Size of downloads: 0 KiB

Would you like to merge these packages? [Yes/No]
And viola. I am able to print!
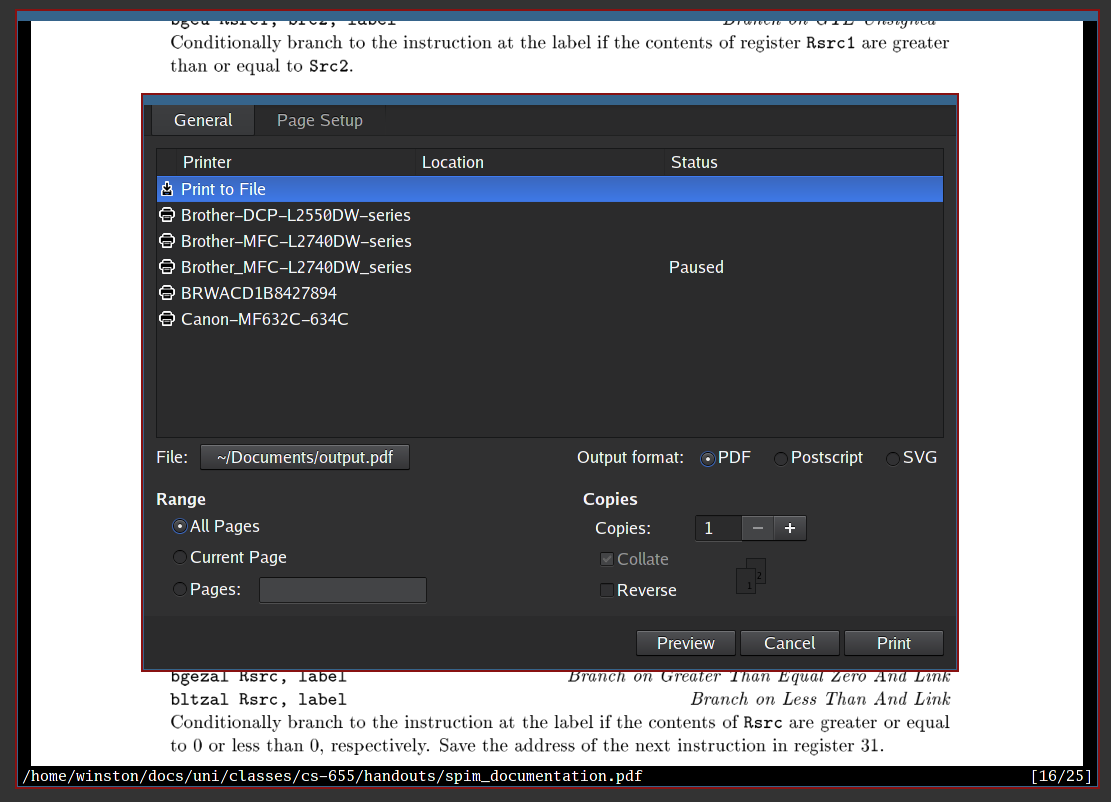
Figure 2: gtk print dialogue success!
§Conclusion
In this post, I described several related challenges:
- How to get a backtrace
- What happens when seccomp blocks ptrace
- How to install debug symbols and source code on Gentoo
- What it looks like to pick apart a backtrace
- And how I fixed this particular issue
In retrospect, I should have reported the bug to the gentoo tracker, because this was a bug due to the selection of patches cherry picked off the gtk git repository. Thankfully the affected versions of GTK are no longer in the official gentoo ebuild repository. I’ll be sure to report such bugs going forward! It pleases me how easy Gentoo makes it to debug stuff.
I found the entire experience here informative, but also incredibly
irritating. I’m no stranger to debugging crashes and grabbing debug
symbols. When something gets in the way of getting backtraces,
things really get very frustrating. The debugging part is the fun
part; dealing with wildcards like seccomp preventing ptrace() with
no meaningful error messages is a huge time waster.
The lack of literature about debugging seccomp enabled applications was a factor in this frustration. I only figured out the issue due to taking the time to read the source code, grepping for ptrace, and understanding seccomp as its used in Zathura. Had I read the README I could have saved some time; It’s important to read all the documentation.
If you made it this far, you have a lot of patience for ramblings and hobbyist computing. You’re terrific! Next time you run into a segfault, put what you’ve learned to good use!